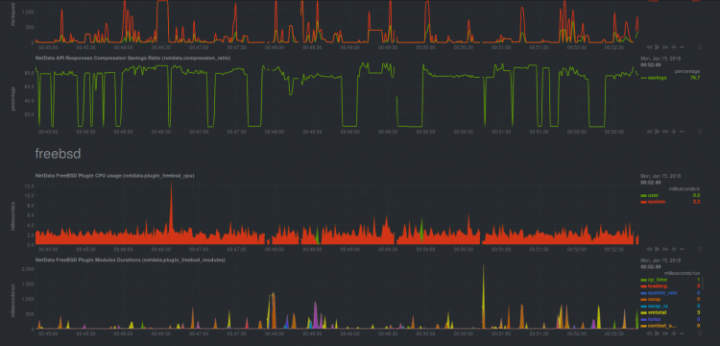
Netdata is a real time monitoring software that allows administrators, developers and architects have a visual representation of a system’s performance live. In short, porn for system’s tuners and other masochists but also a great tool to check system’s behaviour under load giving all members of a team to look at their part while the system is running.
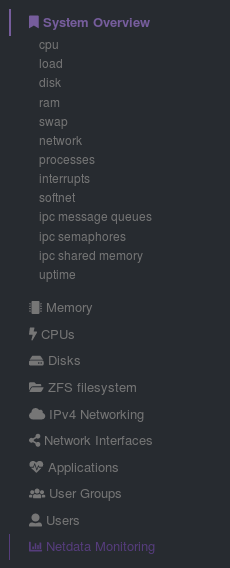
Since Netdata is a graphical tool you have a menu on the right where the topics are distributed as: system overview, memory, cpu, disks, special file systems as ZFS have their own tab too, IPv4 networking, network interfaces, applications, user groups, users, and netdata itself. All these things live, in real time, visually on one or multiple screens. Ain’t it great? Yes, indeed.
If you find the articles in Adminbyaccident.com useful to you, please consider making a donation.
Use this link to get $200 credit at DigitalOcean and support Adminbyaccident.com costs.
Get $100 credit for free at Vultr using this link and support Adminbyaccident.com costs.
Mind Vultr supports FreeBSD on their VPS offer.
If this hasn’t been enough to convince you Netdata is extensible through plugins so you can add them and have live monitoring for many different sorts of software, file systems, network devices, security programs such as fail2ban, web servers, database servers, dns servers, mail, etc. To have a view on them you can check this URL on the project’s github page.
Now that the short presentation has been made and since I’d like to make things very simple I will make a very short guide on how to install Nedata and a simple demo of the use of this software. As other times I will work on the FreeBSD platform but almost everything will work identical on any GNU/Linux OS you’re using, although at the time of writing there is no package on Ubuntu, for example. The first thing I will do is set a clean jail to work with and make the installation process and after than I will do the demo with a web server running and a second server hitting the web server with requests so you can see a load in progress and the monitoring software doing its job.
Since I am a huge fan of FreeBSD jails I just can’t hold myself and I have to recommend you read this article of mine and if you like them just explore the internet for more information about it.
I start by creating a new jail. If you are not familiar with the concept this is just setting a new virtual machine in VMWare, Hyper-V or the like. So for you this is the equivalent of spinning a new server and install the OS on it.
albert@BSDVM:~ % sudo iocage create -r 11.1-RELEASE -n netdata ip4_addr="em0| 192.168.1.230/24"
netdata successfully created!
albert@BSDVM:~ %
Now the jail has been created I will start it up and log into it.
albert@BSDVM:~ % sudo iocage start netdata
* Starting netdata
+ Started OK
+ Starting services OK
albert@BSDVM:~ % sudo iocage console netdata
FreeBSD 11.1-RELEASE-p4 (GENERIC) #0: Tue Nov 14 06:12:40 UTC 2017
Welcome to FreeBSD!
…..
root@netdata:~ #
As on any new install we pull the pkg repository information to get the most recent list of packages available.
root@netdata:~ # pkg bootstrap
The package management tool is not yet installed on your system.
Do you want to fetch and install it now? [y/N]: y
Bootstrapping pkg from pkg+http://pkg.FreeBSD.org/FreeBSD:11:amd64/quarterly, please wait...
Verifying signature with trusted certificate pkg.freebsd.org.2013102301... done
[netdata] Installing pkg-1.10.3_1...
[netdata] Extracting pkg-1.10.3_1: 100%
root@netdata:~ #
We now look for Netdata.
root@netdata:~ # pkg search netdata
netdata-1.9.0 Scalable distributed realtime performance and health monitoring
root@netdata:~ #
Since Netdata has a standalone web server itself we do not need to have a FAMP stack in place or some sort of platform beneath it to function, which is great news and saves time. So we install it:
root@netdata:~ # pkg install netdata
Updating FreeBSD repository catalogue...
FreeBSD repository is up to date.
All repositories are up to date.
The following 8 package(s) will be affected (of 0 checked):
New packages to be INSTALLED:
netdata: 1.9.0
e2fsprogs-libuuid: 1.43.8
python27: 2.7.14_1
readline: 7.0.3_1
indexinfo: 0.3.1
libffi: 3.2.1_2
gettext-runtime: 0.19.8.1_1
pkgconf: 1.3.10,1
Number of packages to be installed: 8
The process will require 77 MiB more space.
13 MiB to be downloaded.
Proceed with this action? [y/N]: y
A few install messages later we have already installed Netdata on FreeBSD. And of course we have to enable it starts up at boot time. To do so we type:
root@netdata:~ # sysrc netdata_enable="YES"
netdata_enable: -> YES
root@netdata:~ #
We check it has been correctly written to the /etc/rc.conf file by doing like this:
root@netdata:~ # cat /etc/rc.conf | grep netdata_enable
netdata_enable="YES"
root@netdata:~ #
Now we see it’s been correctly set we start Netdata.
root@netdata:~ # service netdata start
Starting netdata.
root@netdata:~ #
We check it’s actually running.
root@netdata:~ # ps aux | grep netdata
netdata 4992 0.2 3.0 152748 125236 - INJ 22:40 0:00.64 /usr/local/sbin/netdata -u netdata -P /var/db/netdata/netdata.pid
netdata 4994 0.0 0.1 14896 2356 - SNJ 22:40 0:00.04 /usr/local/libexec/netdata/plugins.d/apps.plugin 1
root 4999 0.0 0.0 14828 1812 2 R+J 22:40 0:00.00 grep netdata
root@netdata:~ #
It is, indeed. Before heading to the browser and check it working we have to be aware of two critical things. We should better have proxy server with some authentication method so no one can look at our server stats from the open internet. The second question to have in account is Netdata usuarlly works through port 19999, so make sure your firewall isn’t blocking that. It’s not funny when you realize something isn’t working because you forgot such a simple thing.
To make things simple I won’t set a proxy server on this guide (I will do this on another article) and we will perform the demo on a local network environment. This can be your setup on your small company or your big corporation since you may have almost all the traffic blocked and just work internally with your servers not being faced to the big and wild internet.
So we now head to our browser and point to the IP of the server where Netdata is working on:

And we will get a very nice monitoring chart view.
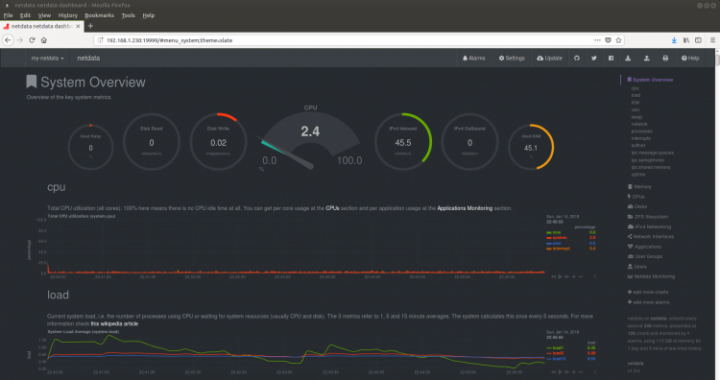
As you can see we have a good menu with plenty of options.
After the install, the demo. As mentioned before I installed Netdata on the same server I have a web server currently working with a full WordPress install with a website already in place with posts, pages, comments, plugins, etc. It is a mock server though, this is not real traffic but it will perfectly work as a demo/test scenario.
The website is running on IP 192.168.1.105. It will be hit from another server sitting on 192.168.1.104. From there requests to port 443 will be performed by a program called siege. Siege is used for load testing and web server benchmarking. It’s simple to use and will serve us right.
I launch siege for two seconds so you can get an idea of how it works.
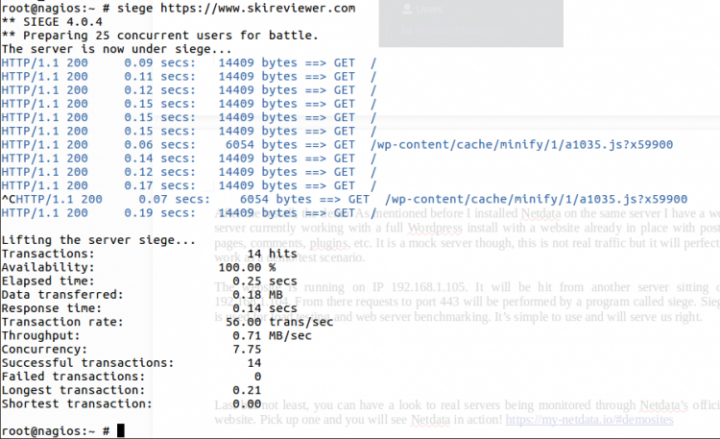
I now start it up again so it makes requests to the webserver and netdata starts getting a load and registers it. And these are the results in form of screen captures.
Here you have the CPU overview. On the right you can see it is starting to show the incoming requests.
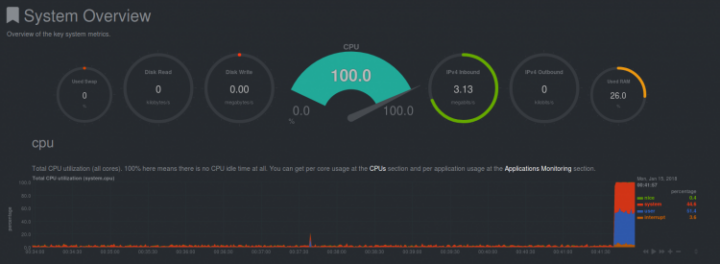
Now the ram overview. It hasn’t changed that much, just look at the red line it thickens a tiny bit.

Load, just as with top but with nice colours and so.

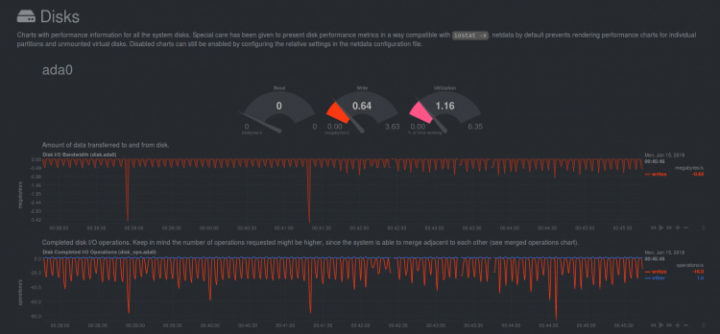
Disk activity overview wasn’t showing much but the detailed view did.
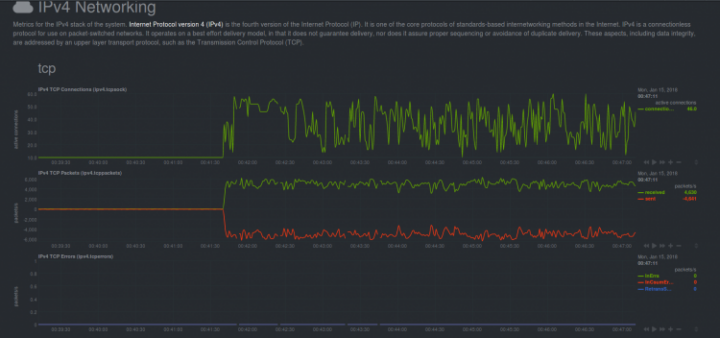
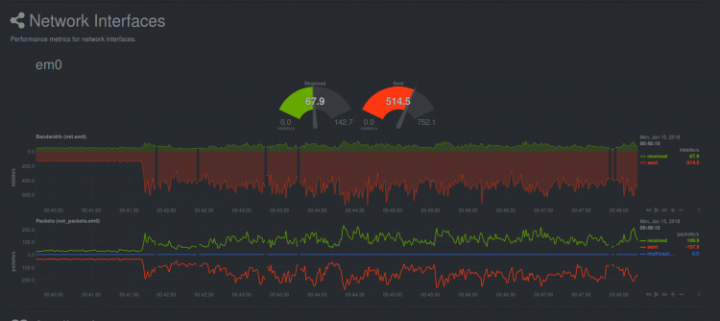
The network overview started showing the load.

But the detailed view gave much more colour.

Here some memory stats.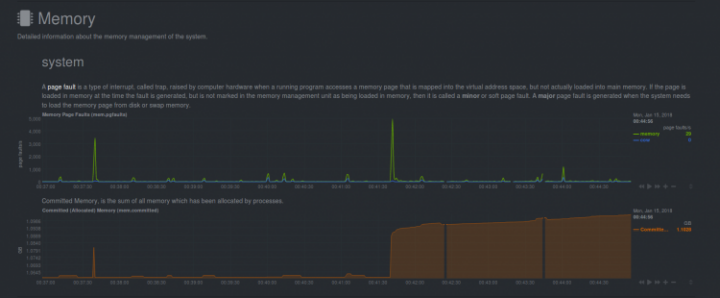
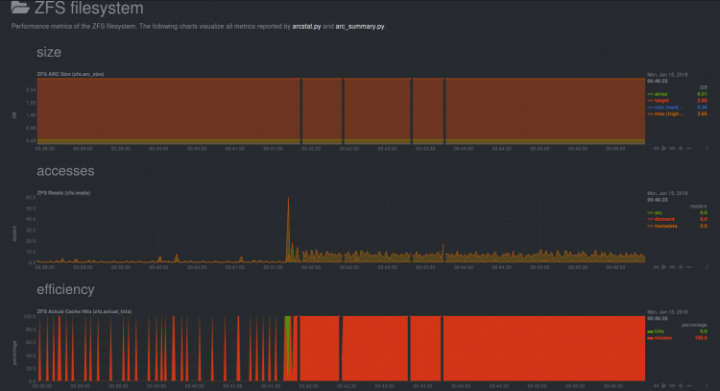
Netdata is also aware of ZFS.
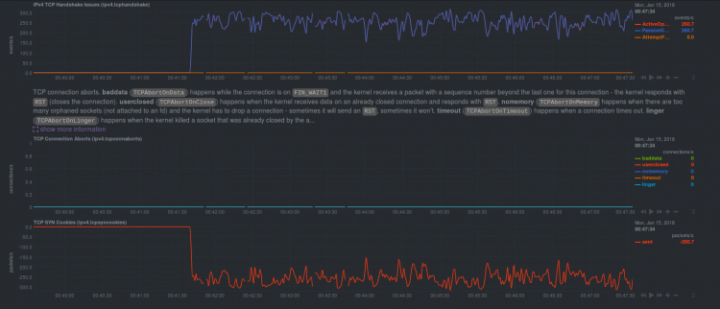
Networking has a great view too with many specifics on display.

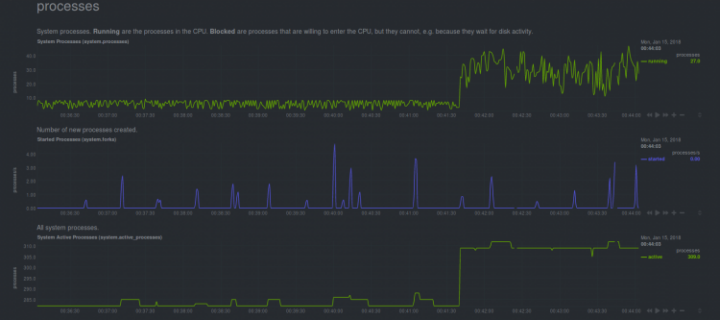
Finally the detailed processes view gives us great detail too.

Detailed view for processes:
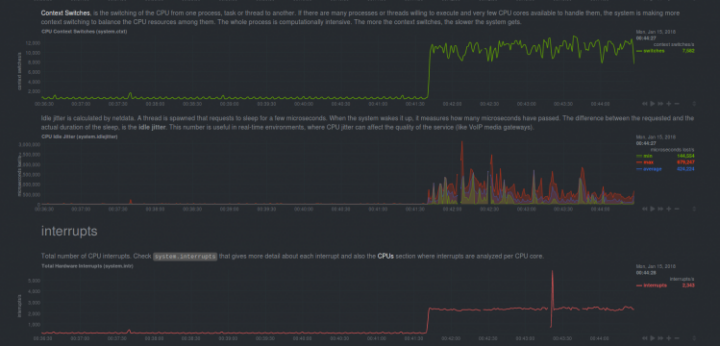
As you have seen a great tool to have in place, specially if you are dealing with more than a handful of servers. Last but not least you can have a look to real servers in real time being monitored through Netdata’s official website. Pick up one and you will see Netdata in action!
If you find the articles in Adminbyaccident.com useful to you, please consider making a donation.
Use this link to get $200 credit at DigitalOcean and support Adminbyaccident.com costs.
Get $100 credit for free at Vultr using this link and support Adminbyaccident.com costs.
Mind Vultr supports FreeBSD on their VPS offer.